Bitcoin Tests Support Near $80,350 as $78,000 Risk Looms
Bitcoin traded near $80,500 in the source’s Saturday snapshot, with sellers pressing short-term support. A break below $80,000 could deepen the decline, while $82,000 remains a key recovery hurdle.
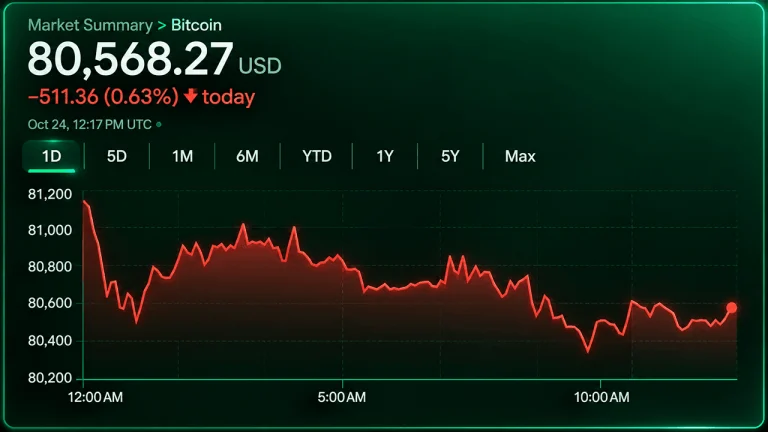
Bitcoin traded near $80,500 on Saturday morning, Oct. 24, as sellers maintained control of shorter trading time frames, according to Bitcoin.com News. Its technical analysis flagged the risk of a retreat toward $78,000 if nearby support fails, while noting that longer-term indicators remained more constructive.
The report placed the cryptocurrency close to the bottom of its daily range. Exchange aggregation sites recorded a 24-hour low of $80,409, while Bitstamp chart data identified a separate support reference near $80,351. Those observations describe different market measurements, rather than a single price floor confirmed across trading venues.
The immediate issue is whether buyers can absorb selling around that support area. Support is a chart reference where a decline may encounter buying interest, not a guarantee that prices will stabilize. A sustained move beneath it would weaken the case for a near-term recovery without, by itself, establishing how far bitcoin might fall.
Bitcoin.com News identified $80,000 as the next important threshold below the nearby support zone. Its analysis said a daily close beneath that level would strengthen the possibility of a move toward $79,000 and potentially $78,000. Those figures represent conditional downside scenarios, not prices bitcoin had already reached in the reported snapshot.
On the recovery side, the report highlighted resistance between $81,500 and $82,000. A sustained move above $82,000 would begin to challenge the bearish short-term structure. Until then, a bounce would leave unresolved the central question of whether buyers can turn an attempted recovery into a more durable change in direction.
The indicator readings reflected that uncertainty rather than a uniform sell signal. Around 10 of 15 moving averages favored the downside, but nine of 11 oscillators were neutral, according to the report. That split matters because price-trend measures and momentum gauges were not delivering the same degree of bearish confirmation.
Moving averages smooth past prices, while oscillators help assess momentum and related trading conditions. Their disagreement can leave a market vulnerable without establishing that a sharper decline is inevitable. In this case, largely neutral oscillator readings tempered the bearish message coming from the shorter-term price structure.
The longer-term picture also remained distinct from the immediate selling pressure. Bitcoin.com News reported that longer-horizon moving averages retained positive positioning even as shorter-term measures weakened. That contrast means the latest decline should not automatically be treated as confirmation that every time frame has turned negative.
The next technical test is therefore two-sided: whether bitcoin holds the support area near $80,350, and whether any rebound can recover $82,000. In the source’s assessment, losing support would increase downside exposure, while clearing resistance would weaken sellers’ advantage. Neither outcome was confirmed by the snapshot.
Primary source: Bitcoin.com News. Newzly rewrites and structures source reporting for clarity; verify critical details at the original.